This page is outdated. Check out our latest guides.
This guide is intended to give you a quick introduction how to use the Smart Forex Tester Suite. For more details, please refer the User’s Guide and inbuilt GUI help (“?” buttons).
Note that while we will be referring to testing, all the same actions are directly applicable when you want to trade: by design, the Suite works the same for both.
To run any test, you need to execute 3 steps: select a data source, select a trading strategy, press the (green) Play button on the GUI Toolbar.
Data sources
Each data source has its own button on the main GUI Toolbar. Available options are:
- Online. Forward test on real-time quotes by TrueFX.
- Offline. Back test on the quotes from file.
- MT. Live test/trade via the MT4 Terminal.
- Copy. Live test on TrueFX quotes copied into the MT4 terminal.
In the Copy mode, the PPA signals are generated and trade decisions are made on the TrueFX price feed, but in the trade execution the prices from the MT4 data feed are used. You can execute trades either in the MT4 terminal, or in the internal simulator (the selection must be done before the test is started).
Trading strategies
There are 2 types of strategies that the Suite supports: internal and custom.
You can select a trading strategy in the drop-down list on the Tester tab.
Internal trading strategies
The software is delivered with a set of inbuilt strategies. These can’t be modified by a user, but you can change their parameters. The change is dynamic – the new parameters are activated from the next tick or the next trade.
Parameters are changed from the Trader GUI. You can open it by clicking the “$” button on the Toolbar.
Custom trading strategy
In addition to internal strategies, the Suite provides a C++ environment where you can develop your own trading strategy that has access to the Pivot Point Analyzer signals at the same tick they are generated.
To get you started, we will show you a concrete example of running a test, for which we will use the sample 3 RSI based trading strategy that is provided with the Smart Forex Tester.
The strategy is very simple and was developed for educational purposes. However, it is fully functional and in the absence of trend is quite often profitable.
The strategy works as follows. When RSI indicators for 3 different time frames exceed predefined maximum values, we consider it a sign of a market top and place a SELL order. If there were an active BUY order, we close it first. Correspondingly, if all RSI values fall below predefined minimum values, we close the SELL order and open a BUY order.
You need to download the zip-file and extract the .cpp strategy file from archive.
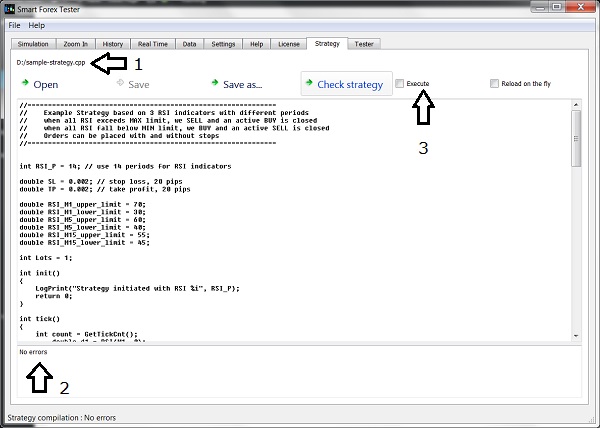
Let’s start our example. Launch the Smart Forex Tester software, and the first step is to load the strategy. Go to Strategy tab and click Open button, then select the unzipped .cpp file. The tester reads the file and shows it in the edit window. See the (1) on the below screenshot.

Next step, you might want to adjust the RSI limits. Click Save button. Then you click on Check strategy button – to start the C++ compiler. You should see No errors message in the bottom window (2). Now, the Execute box (3) becomes active and so you need to check it to enable strategy running.
Now we need to select the data to test on. Let’s start from testing on the historical prices.
Back Testing on Historical Market Data
Go to the Data tab. For your convenience, we provided an inbuilt data file there. Use it for a quick start.
Click Load sample data button and wait for the Tester to load the ticks that span 2 days. That’s it – nothing else needed. Though if you want, you can change the test start date/time.
Now you are all set! Switch to the Tester tab and click Start button. This will start your test, and the Tester automatically switches to the Simulation tab, where you can follow the test in graphical mode.
Note, however, that the test runs fastest when the Tester is not plotting simultaneously with the calculations. So, if you want the test results as quickly as possible, it is better to monitor the test progress from the Tester tab.
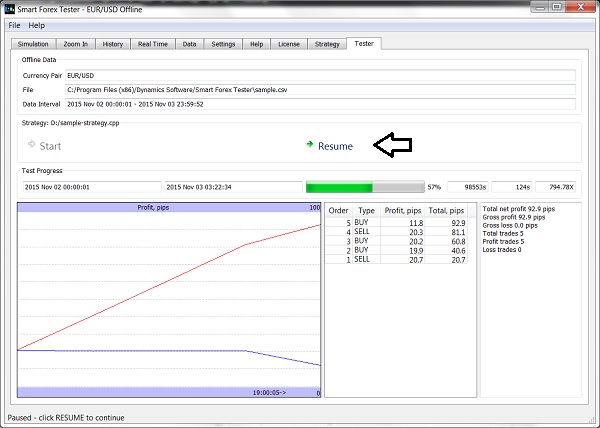
If you want to check the details of the trades, you can always pause the test and then resume – see the screenshot below.

The Tester dashboard shows the test report in the right window, and summary of the trades in the middle window. The History tab will have full information on orders.
The chart on the left shows profit per each closed trade and also cumulative value.
Forward Testing on real-time Market Data
Another supported option is testing on live market prices. If the Forex market is open, you can test the strategy in real-time. It requires decent Internet connection.
Go to the Real Time tab. There you can select a currency pair from the drop-down list and click Start Online Simulation button.
The Tester will fetch about 4 hour of ticks preceding the current time. So as you compiled and activated the strategy before starting live data feed, the test will also be run on this saved historical data.
Meaning the strategy can place orders during data download. And when the download is complete, it will continue working on the live feed.